Map Field Trials Efficiently with Zonal Statistics
Streamline your work with field trials with our automated workflow for plot extraction and analytics.
Try Solvi for free
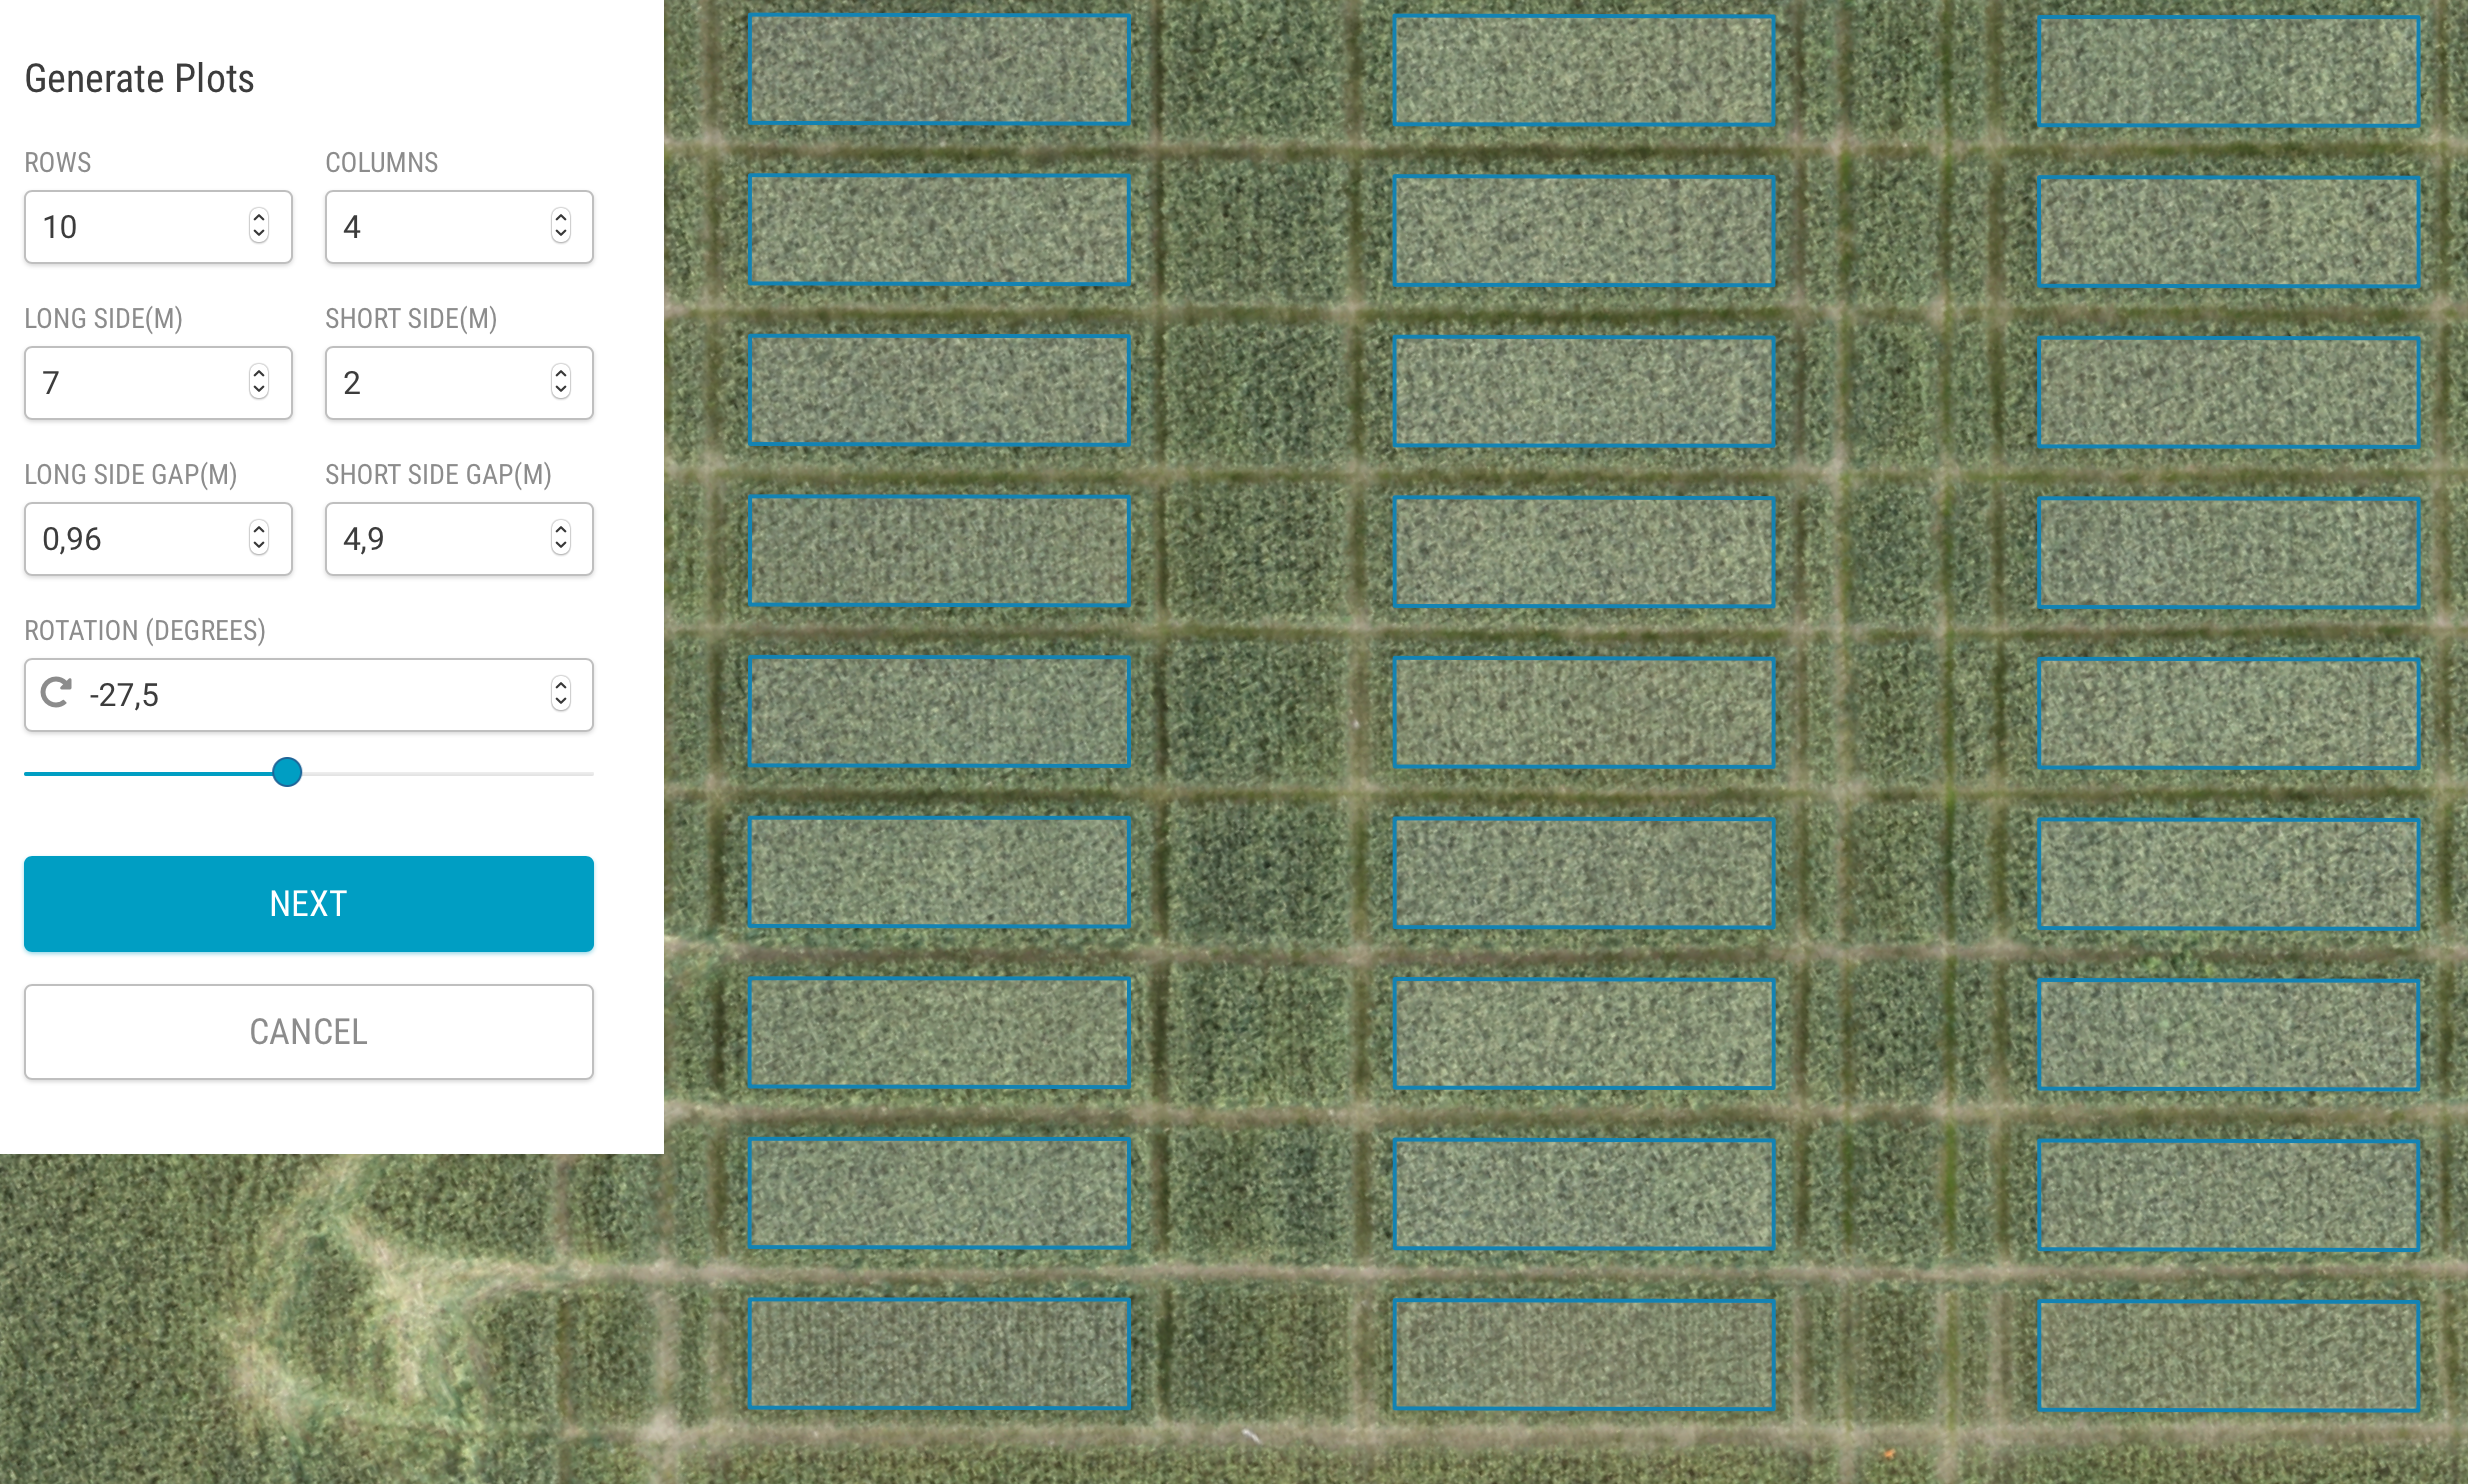
Extract Plot Boundaries
Use automatic plot boundary extraction or flexible editing tools to generate plots quickly and efficiently, or import existing boundaries from SHP or KML files.
- Automatic plot boundary detection
- Flexible tools for plot generation and labeling
- Advanced plot editing tools
- Import existing plots from SHP and KML files
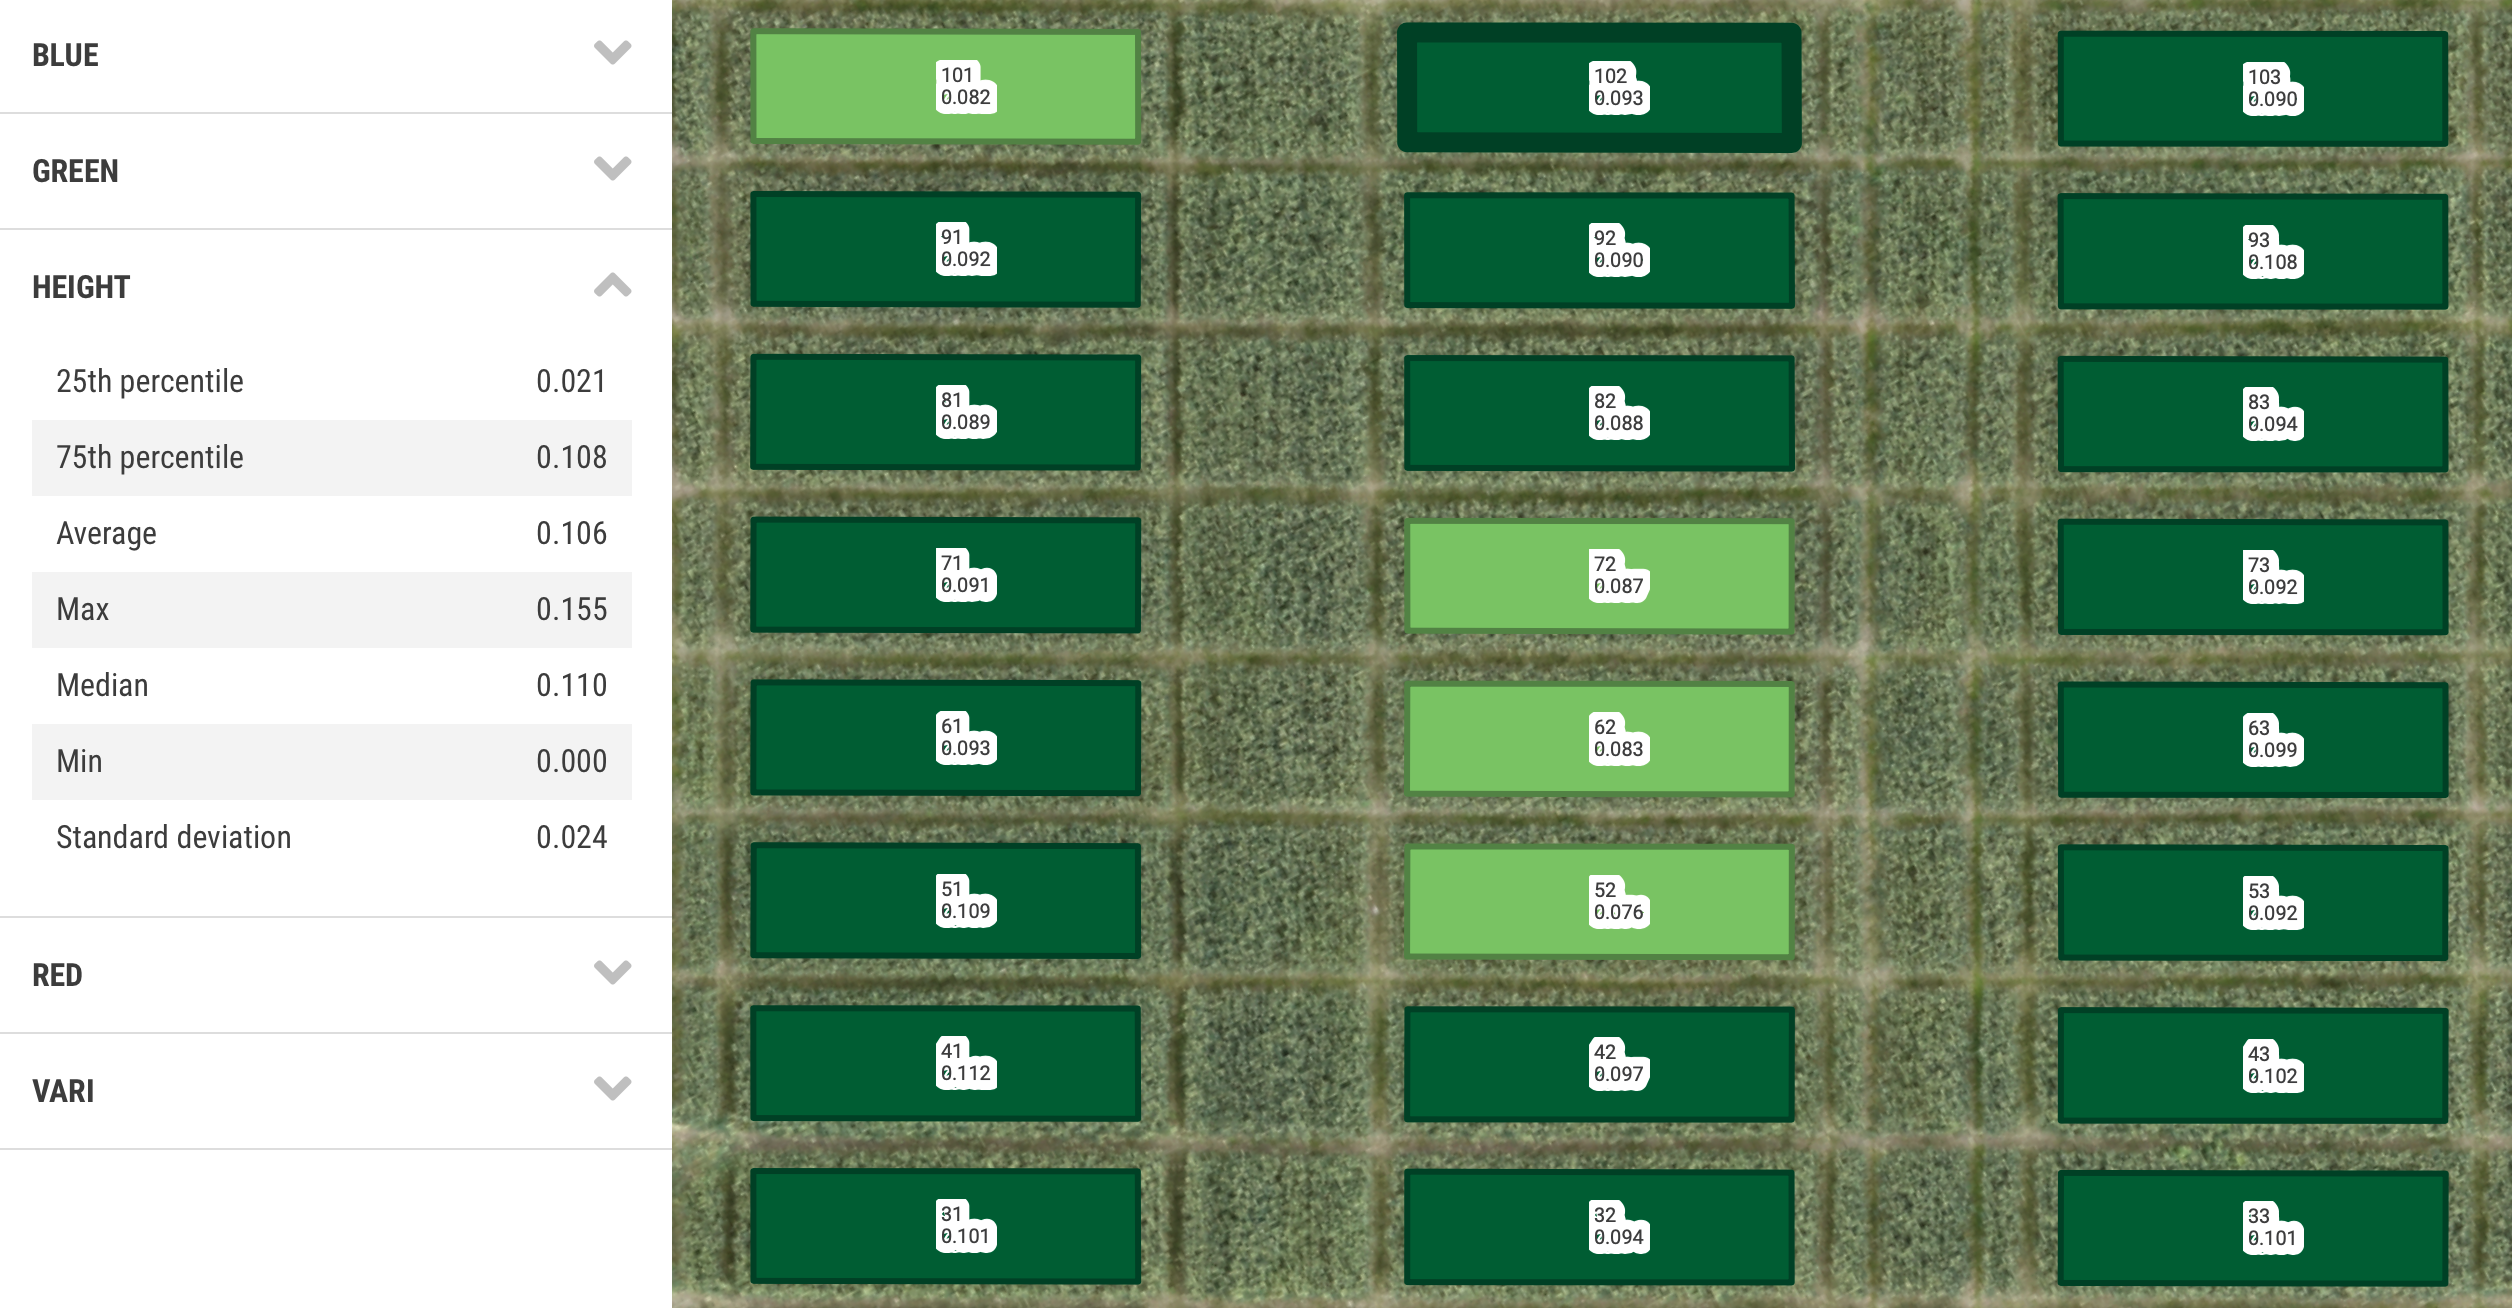
Calculate Statistics
Generate a comprehensive list of statistics for every plot for a variety of vegetation indices, raw band value, plant counts, and elevation data - all in a single click.
- Comprehensive plot-level statistics
- Metrics for vegetation indices and raw band values
- Statistics for plant counts and plant height
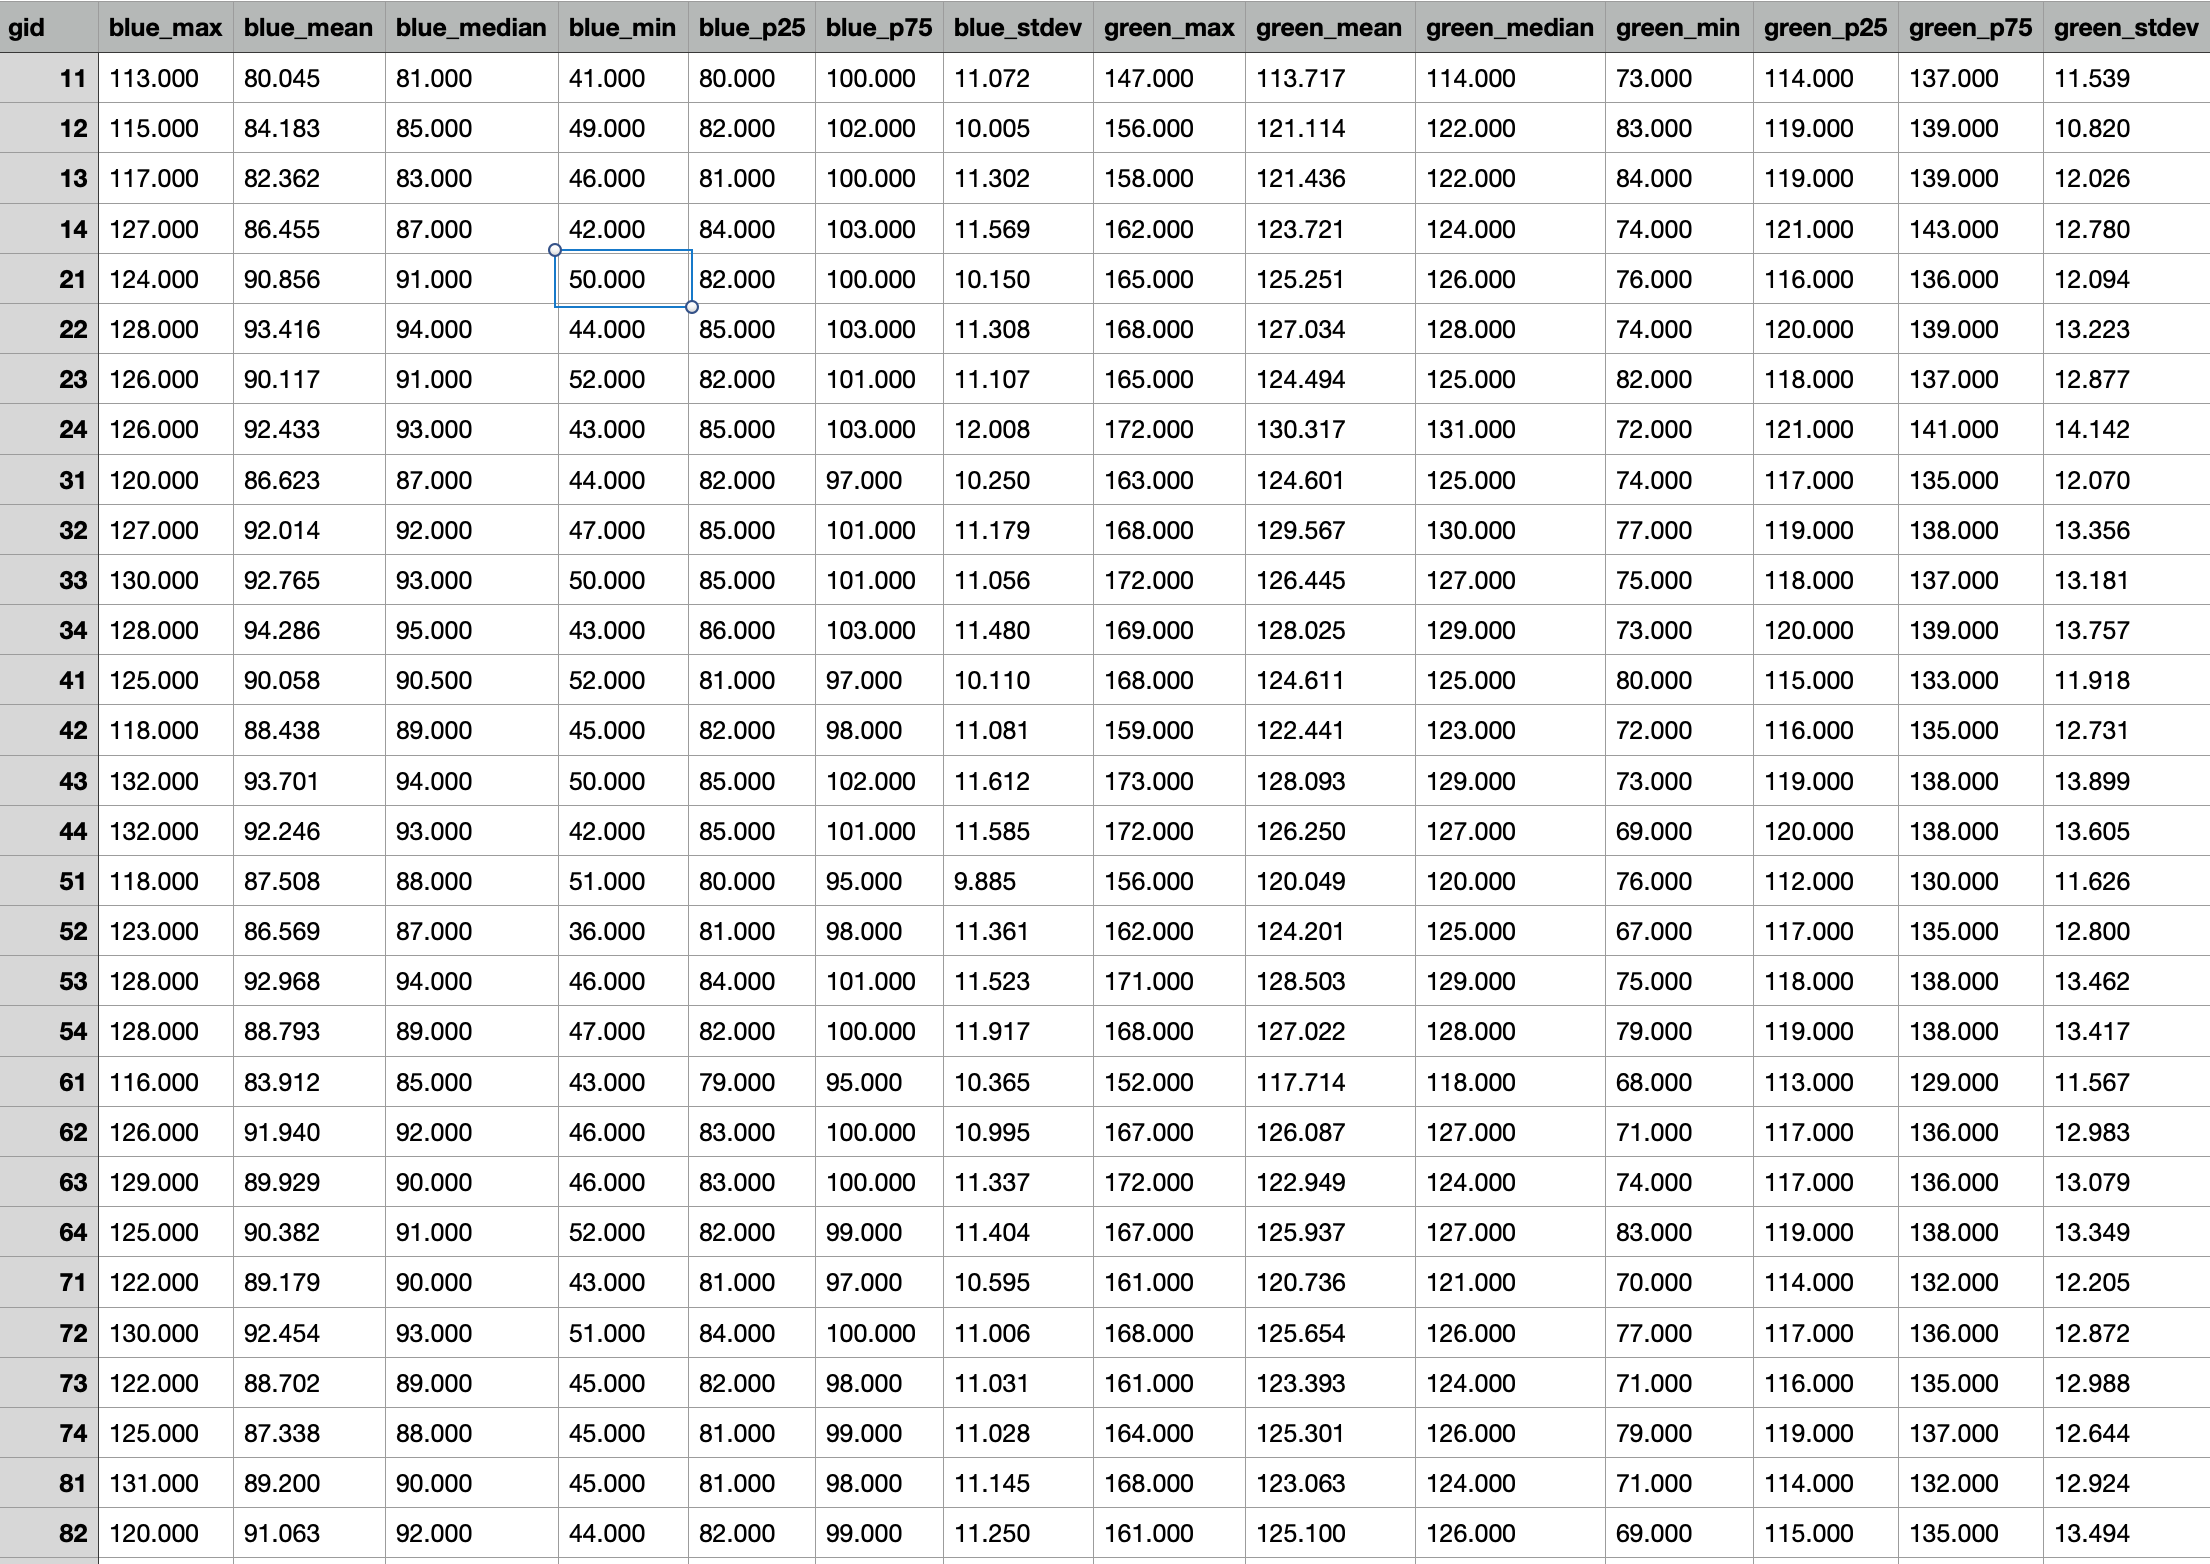
Share and Export
Export all plot boundaries and statistics to SHP and Excel files for further analysis in other software, or share with others with publicly accessible web links.
- Export to Excel and SHP formats
- Share with public web links

The Zonal Statistics tool in Solvi makes image analysis and data management much more efficient and streamlines the whole workflow. It really changes the way agronomists work with field trials.
Mats Söderström
Researcher at Swedish University of Agricultural Sciences

Ready to get started?
Take your reasearch to the next level with Zonal Statistics
Try Zonal Statistics Today